Aerial Solar Thermography and Condition Monitoring of Photovoltaic Systems
InfraMation 2011 Application Paper Submission
Harley Denio III, Level I Thermographer, Oregon Infrared LLC
Harley Denio II, Level III Thermographer, Oregon Infrared LLC
ABSTRACT
This paper illustrates how infrared thermography can be applied to determine the operational status of photovoltaic solar systems on a large aerial scale. Solar thermography is the use of an infrared camera to inspect photovoltaic solar systems for problems that can cause damage to the cells, loss of efficiency, and fire hazards. The demand for cheap renewable energy sources is at its highest resulting in a significant increase in the construction of solar arrays and installations. In this rush for renewable energy there is a growing need for accurately presented maintenance data. The difficulty of tracking down problems and potential issues that arise in these installations is monumental. Infrared thermography has proven to be a valuable resource that can be used on a wider scale to pinpoint problems in these large arrays.
INTRODUCTION – WHAT IS PHOTOVOLTAIC TECHNOLOGY?
When using infrared thermography in relation to solar energy it helps to understand the fundamentals of solar power. Every location on earth receives sunlight. The amount of solar radiation that reaches any one spot on the earth's surface varies according to: geographic location, time of day, season, local landscape, and local weather. Countries like the United States, which lie in the middle latitudes—especially areas in the American Southwest—receive more solar energy in the summer because the days are longer and the sun is positioned directly overhead. Such areas are ideal for harnessing solar radiation to be converted into usable power.
Photovoltaic cells convert sunlight into electrical energy and are commonly known as solar cells. Photovoltaics, literally translated as light-electricity, take advantage of the photoelectric effect to produce electricity. These cells are the building blocks of all photovoltaic solar systems.
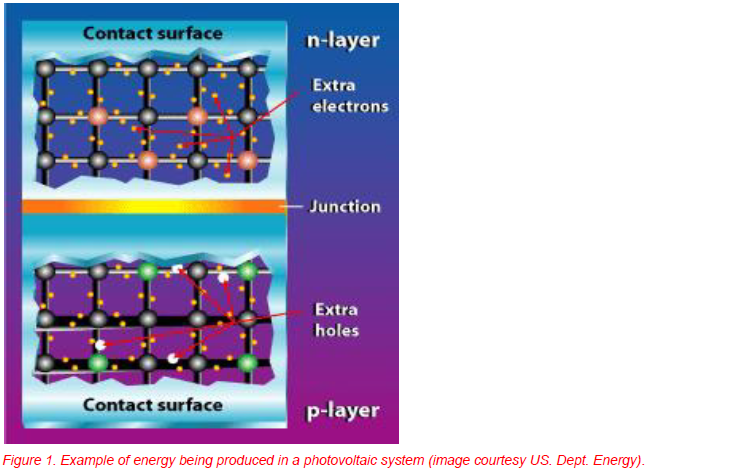
To generate an electrical field within a crystalline silicon cell, two silicon semiconductor layers are put together. P-type, or positive semiconductors, have an abundance of positively-charged holes. N-type, or negative semiconductors, have an abundance of negatively charged electrons. When the n- and p-type silicon layers come together, extra electrons move from the n-type side to the p-type side. The result of this action is a build-up of positive charge along the n-type side of the interface and a buildup of negative charge along the p-type side. Because of the flow of electrons and holes, the two semiconductors behave like a battery, creating an electric field at the surface where they meet. In this electrical field, the electrons move from the semiconductor toward the negative surface, making them available for the electrical circuit. At the same time, the holes move in the opposite direction, toward the positive surface, where they await incoming electrons.
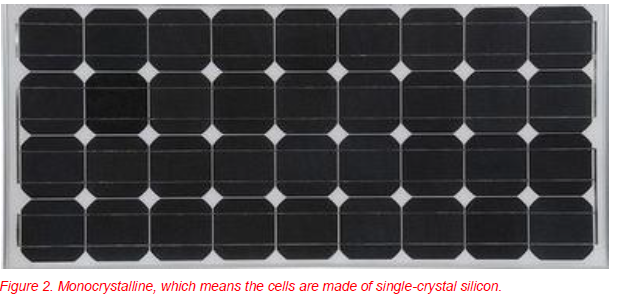
The majority of panels being produced use silicon wafers in their construction and consist of three main types of panels; monocrystalline, polycrystalline, and amorphous.
Monocrystalline panels are silicon cells made up of a single piece of grown silica sliced in a wafer that is connected to a rigid substrate with a metal frame. These cells are combined to make a solar panel. Most monocrystalline solar panels have a glass or laminate covering on the top of them.
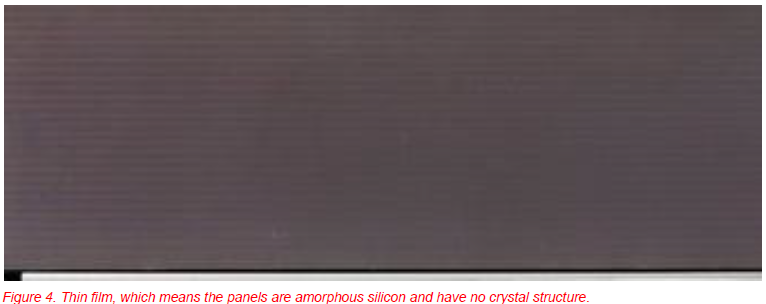
Amorphous solar panels consist of a thin film-like material made from molten silicon that is spread directly across large plates of stainless steel or a similar material. These types of solar panels have lower efficiency then the other two and are the cheapest to produce.
AERIAL THERMOGRAPHIC TESTING
It is important for all of the solar cells to work together to efficiently produce the maximum output of electricity. When individual cells become damaged, due to defects in manufacturing or external incidents, the power output lowers and efficiency drops. Unfortunately, it is extremely difficult to see any of these problems with the naked eye. The only way to test the panels for efficiency is to take a voltage reading, which can be a massive undertaking considering that each array can have 15 to 20 panels, and some sites have thousands of arrays. For accurate and timely results, infrared thermography is invaluable.
Infrared thermography can see the heat differential between solar cells and determine whether any of those cells are damaged or defective. In some cases, problems in smaller solar sites can be found on a walk through infrared scan. Unfortunately some arrays are so large that ground testing would be far too time consuming.
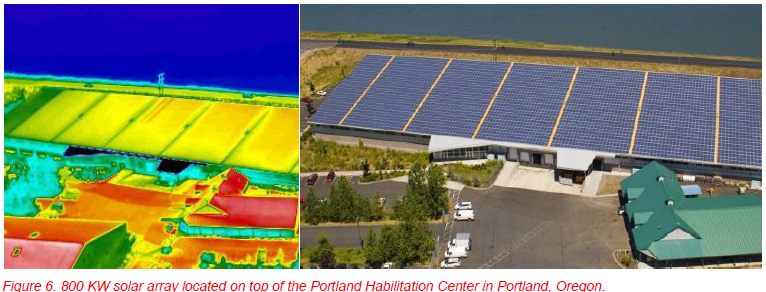
The 800 KW array located on top of the Portland Habilitation Center in NE Portland Oregon is like many new solar sites built on top of a roof (or located high in the air). Such installations are impossible to look at from ground level and very difficult to scan while standing on the surface, making aerial testing the most viable and accurate solution.
Flying over solar panel arrays allows the thermographer to gather data about a large site in a time-efficient manner. The ability to get a literal “bird’s eye” thermographic view of the array permits pinpoint accuracy down to the cell and significantly decreases the time spent finding and identifying problems.
Before getting up in the air it is important to calibrate your camera for the following:
- Humidity
- Atmospheric temperature
- Distance
- Emissivity
The first two factors can usually be determined by contacting the local weather service, which can also provide wind speed and direction for a complete and accurate scan.
EXCEPTIONS FOUND
Many of the problems found on photovoltaic solar panels have to do with one important issue: hot spot heating, which can occur on a photovoltaic panel because of cell failure, interconnection failure, partial shading, and by having mismatched cells. When these problems occur, a cell in a string of cells becomes negatively biased and, instead of producing electrical energy, produces heat energy. This happens because that cell’s current is lower than those in the string.
These problems documented in Figures 7-10 appeared in individual cells that were producing abnormal amounts of heat. Besides the obvious problem of the cell not producing any usable electrical energy, the cell also has the potential to degrade others around it. Because the silica wafer is manufactured at intense heat, problems from defects in the wiring pose no threat of degradation. The majority of panels are constructed using plastic and other components such as holders, corners, and in some cases covers that can be susceptible to heat damage. Over a long enough period of time, the damaged cell has the capacity to burn through its backing as well as cause the cells around it to become damaged and to overheat, affecting the entire panel.
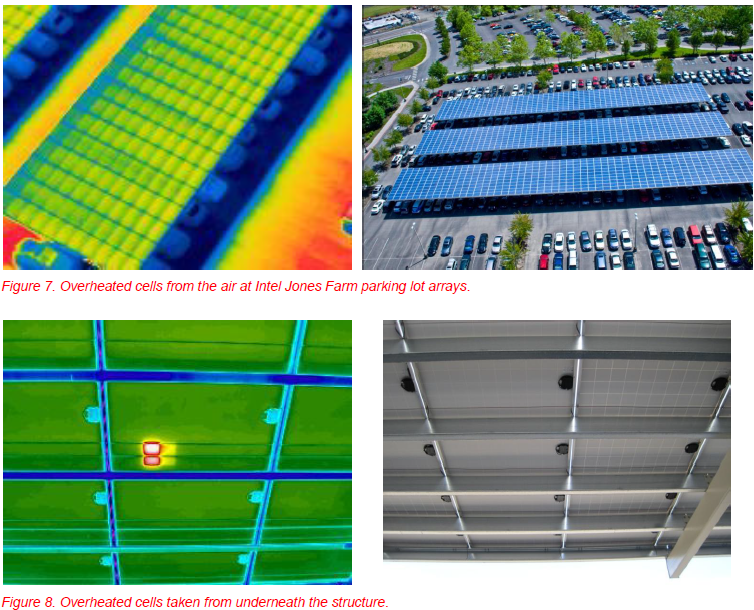
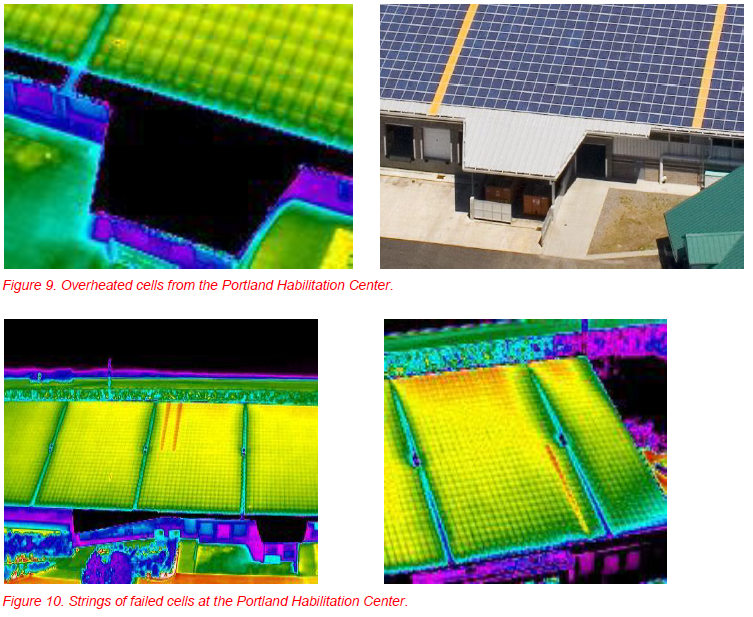
Figure 13 shows a unique phenomenon that is peculiar to the panel manufacturing type found in the Portland Habilitation Center. Instead of the standard practice of soldering the cell’s connections together, these connections are pressed and laminated. These “strings” you see are actually a circuit of cells in series with each other. One of the pressed-on connections shorted out and overheated, causing the rest of the circuit to overheat. When reported to the owners, further investigation was carried out at the ground level and bubbles in the lamination were seen. Those panels in question were replaced and the problem repaired.
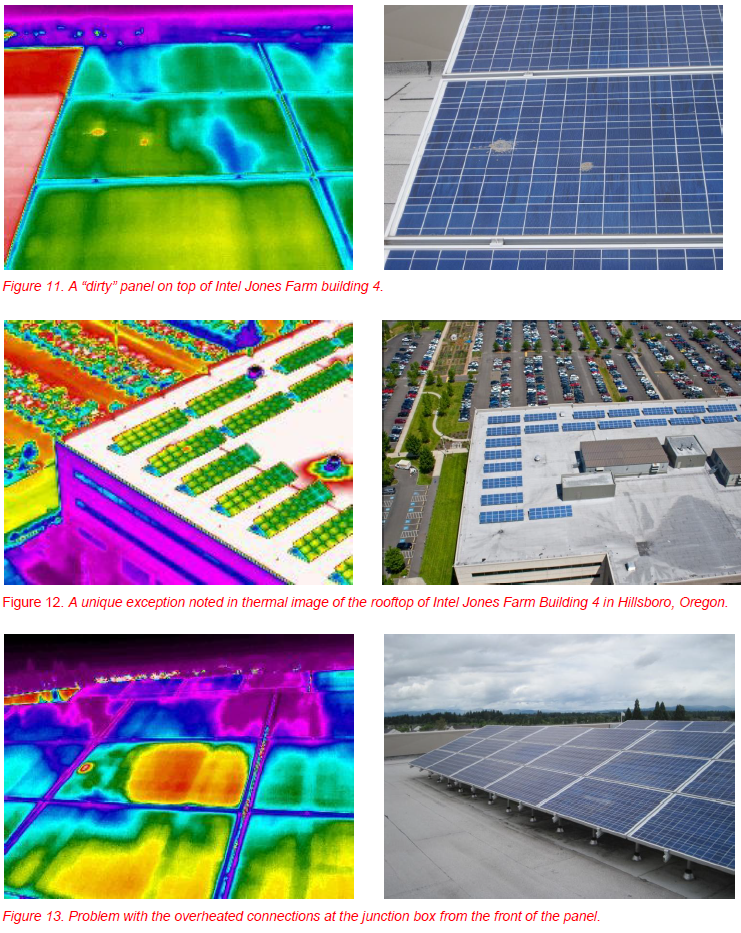
Obstructions like debris, such as leaves, dirt (see Figure 11), snow, and shade from objects around the solar array can cause a cell to become negatively biased and not only cause a significant decrease in output, but can also pose a fire hazard.
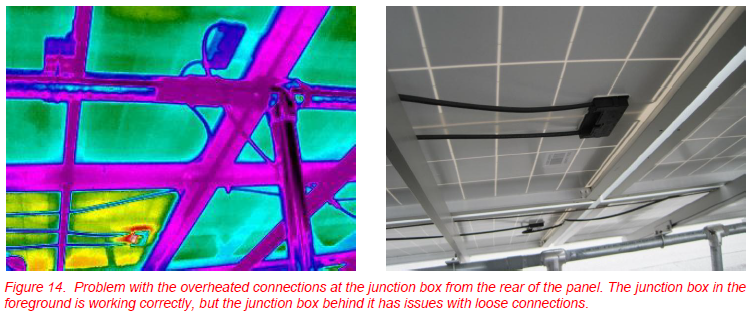
Figure 12 shows a thermographic photo of a hot panel from the air. Subsequently, the problem was verified to be hot connections on a junction box behind the panel (Figures 13 and 14).
INSPECTIONS AT THE GROUND LEVEL
Beyond inspection of solar panels, infrared is also valuable in examining junction boxes, the inverter, and the power systems further down the electrical stream. All can have issues with loose connections and tripped circuits that can put a solar site at physical risk and decrease productivity.
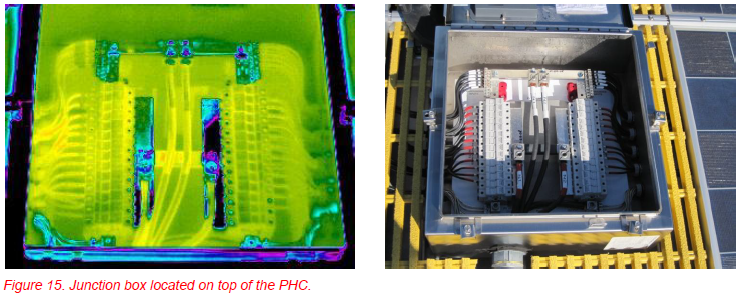
Figure 15 shows a junction box, which appears functional with infrared, but in fact had its seals installed incorrectly and has about 2 inches of water in the bottom. Notice the condensation on the sides of the box. In this case, there is no substitute for an informed visual examination.
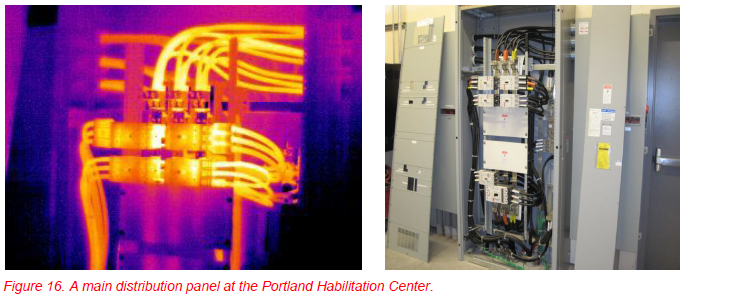
Figure 16 shows an example of a loose connection on the A phase bus bar. This image demonstrates the importance of a thorough thermography scan of the solar site to determine problems before they become catastrophic.
PRE-INSTALLATION ROOF SCANS
Infrared scans of solar arrays installed on roofs can also locate moisture intrusion and structural damage. In addition to the rigorous calculations that determine if the roof is able to take the necessary load, an easy and proven way to determine the condition of a potential roof is by infrared scan.
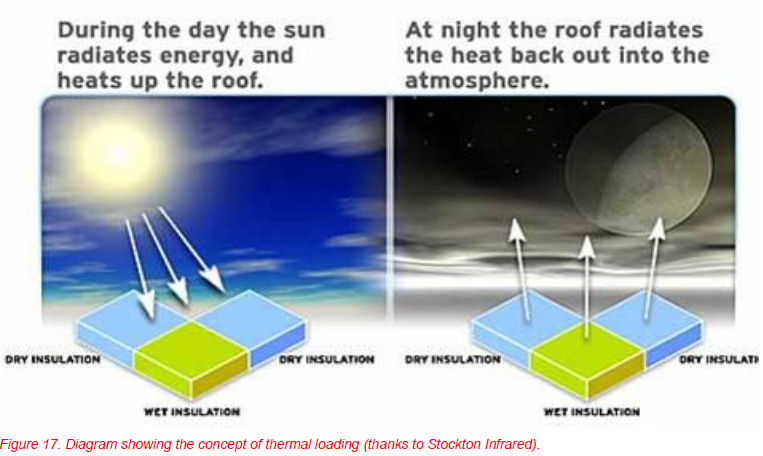
Figure 17 depicts how temperature differential is seen on a roof. The sun heats up the surface during the day to a uniform temperature and at night the dry areas of the roof cool off quicker than the areas that are wet. That temperature differential is easily seen in infrared.
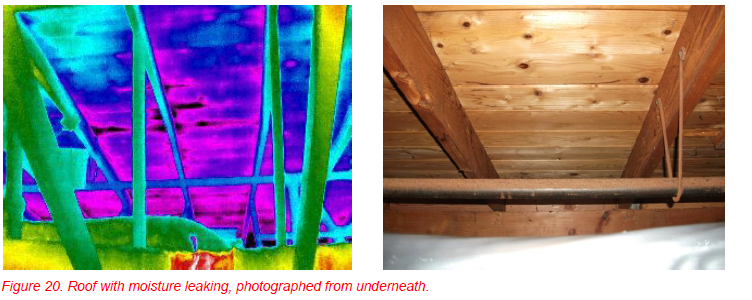
There are several ways to inspect a roof for damage using thermography. One is to get on top of the roof and to use a ladder to look down pinpointing problems. Roofs can also be inspected from underneath. For a more global view, a flyover may be the best solution. All of these techniques enable damages to be assessed.
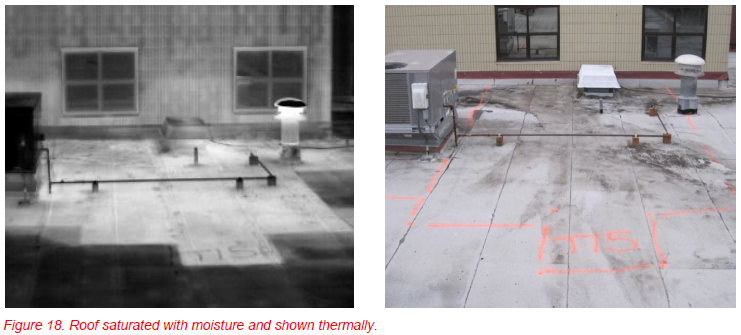
Figure 18 depicts a roof scan looking down from a ladder. With this method, the roof can be physically marked, showing exactly were damages are located. Although more accurate, this method takes significantly more time than flying over a site.

Figure 19 shows the aerial approach which permits a more global view and can be coupled with a roof walk on scan to confirm issues found. Flying over the roof to look for leaks saves time, allowing the thermographer to scan an entire campus with several buildings quickly and maximize that “magic hour” of the day when problems really stand out.
SUMMARY
The importance of maintaining solar panels is finally beginning to become clear in many people’s minds. The rush to install and meet the ever rising demand for renewable “green” energy has left the maintenance lagging behind installation. Although many solar sites appear to be working normally and producing energy at the peak of their efficiency, an infrared scan can reveal problems unseen to the naked eye with aerial infrared allowing for efficient scanning of large solar sites.
Solar technology is maturing and becoming more reliable, with the quality of solar panels improving, with far fewer defects present at the time of installation. Unfortunately, many mature solar sites are currently up and active with panels that do contain defects that need to be repaired. Aerial infrared thermography coupled with confirmation on the ground is the answer to finding and repairing solar arrays with problems in large scale sites.
REFERENCE
“Hot Spot Susceptibility and Testing of PV Modules”; P.547 1991 Molenbroek, D.W. Waddington, K.A. Emery National Renewable Energy Laboratory, Golden Colorado
National Renewable Energy Laboratory <http://www.nrel.gov/>
U.S. Dept. of Energy <www.eere.energy.gov>
The American Solar Energy Society http://www.ases.org/
ACKNOWLEDGEMENTS
The author wishes to thank Oregon Infrared for making these flights possible, Intel Jones Farm for working with him to gather all of the data, and Mark Olson from Dynalectric for his wealth of knowledge.
ABOUT THE AUTHOR
Harley Denio III is an ITC-trained thermographer and has been practicing infrared thermography for 9 years. The aspects of infrared he works with are electrical, mechanical, building sciences, and veterinary. He currently works with Oregon Infrared and is the son of its president, Harley Denio Sr.
Related Articles
-
 Thermography Fundamentals
Know Your Subject Matter
Read the Story -
 Electrical/Mechanical
Five Years of Infrared Results at CNA – March 2005 through June 2010
Read the Story -
 Electrical/Mechanical
Identifying Gear Alignment and Lubrication Concerns
Read the Story